
How to Read Your Dayhoff Health Microbiome Report: A Section-by-Section Guide


This guide explains how to read your Dayhoff Health Microbiome Report, section by section. You'll learn what each part means, how to act on your results, and which findings are worth bringing to your healthcare provider.
What Does Your Dayhoff Health Microbiome Report Tell You?
Your report is the output of shotgun metagenomic sequencing — a method that reads all the DNA in your stool sample, not just a single bacterial gene. The result is a detailed map of every organism detected across your three samples: bacteria, archaea, viruses, and fungi at the species and strain level.
The report is not a diagnosis. It is a biological baseline — a precise starting point for conversations with your healthcare provider and a reference for tracking how your gut changes over time.
Report Sections
Your Dayhoff Health Microbiome Report is organized into six sections. Each section serves a distinct purpose and translates the raw abundance data into actionable steps.
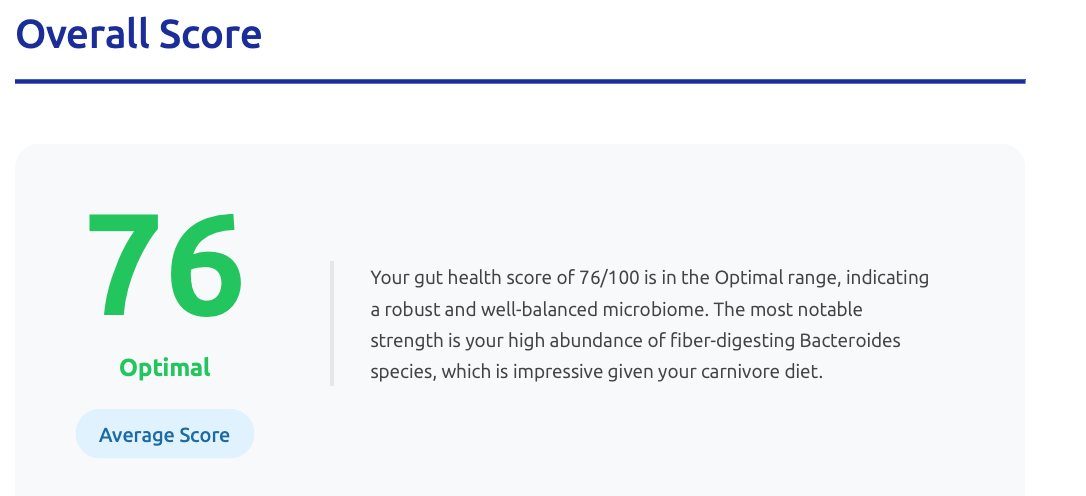
Section 1: Overall Score
Overall Score is a single number, ranging from 0 to 100, the score reflects the balance between beneficial and potentially harmful organisms across all three of your samples. The overall score combines an average of your 3 samples into one score.
Your score falls into one of three ranges:
- Optimal (65–100): Indicates a strong microbial balance with good production capacity for producing key metabolites, and lower abundances of opportunistic and pathogen / disease marking species.
- Moderate (40–64): Room for improvement. Beneficial bacteria are present but may be underrepresented.
- Needs Attention (0–39): Beneficial communities are low or disrupted. Worth discussing with your healthcare provider.
Because Dayhoff analyzes three samples collected over one week, your score reflects your microbiome's actual behavior across variation in diet, stress, and routine. An average score of 72, for example, with individual samples at 73, 71, and 72, is meaningfully more reliable than any single-collection result.
What to track: Compare your score across repeat tests, particularly after significant changes to diet, antibiotic use, or stress load. Pay attention to the changes in scores across the samples, if you see a big difference this may indicate your gut is more sensitive to stressors or changes in your diet.

Section 2: Action Plan
The Action Plan translates your microbiome results into specific, prioritized steps you can take to support your gut health. Unlike generic wellness advice, each recommendation is tied directly to a finding in your individual report, whether that's a shortage of certain beneficial bacteria, low microbial diversity, or an imbalance worth addressing through diet.
How the Action Plan Is Structured
Your Action Plan is organized into numbered recommendations, each presented as a self-contained card. The recommendations are ordered by priority, with the most impactful interventions appearing first. Every card contains four elements designed to give you both the instruction and the reasoning behind it:
What To Do lists the specific actions to take. These are concrete and measurable, for example, "Introduce 1–2 servings of resistant starch daily" rather than "eat more fiber." Each bullet is an action you can begin this week.
Why explains the biological reasoning. This section connects the recommendation back to your specific results, naming the bacteria involved and the role they play in your gut. Reading this section helps you understand why the recommendation matters for you personally, not just in general.
Expected Results sets realistic expectations for what you may notice and when. Microbiome changes typically unfold over weeks, not days. This section tells you what to watch for (improved digestive comfort, more regular bowel movements, reduced bloating) and the approximate timeline (usually 4–6 weeks).
References links to the peer-reviewed research supporting each recommendation. If you want to explore the science further or share sources with your healthcare provider, this is where to start.
How to Use Your Action Plan
Start with one recommendation, not all of them. The microbiome responds more reliably to gradual, sustained changes than to sudden overhauls. We recommend focusing on the first recommendation for two to four weeks before layering in the next.
Keep a simple log of what you change and when. This makes it much easier to identify what's working when you retest, and gives your healthcare provider useful context if you discuss your results at an appointment.
An Important Note
The Action Plan is AI-generated based on your microbiome data and is intended for informational purposes only. It is not medical advice. Always consult your healthcare provider before making significant dietary changes or starting new supplements, particularly if you have an existing health condition, take medications, or are pregnant or nursing.
Section 3: Physician Talking Points
The Physician Talking Points section distills your entire report into a one-page clinical summary — written for your healthcare provider. It is not for a general audience as it includes your key findings, any out-of-range values, and specific organisms worth monitoring.
Bring this section to your next doctor's appointment. It is written to support an informed conversation. Most primary care providers are not microbiome specialists, and this section gives them the context to engage with your data meaningfully.
Section 4: Your Gut at a Glance
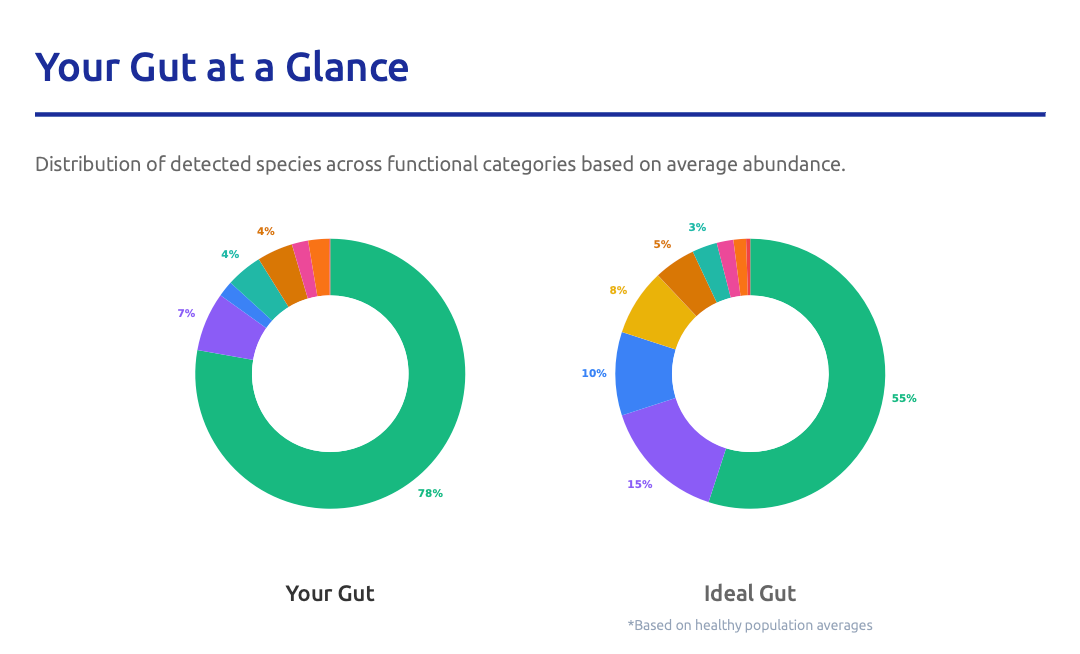
This section gives you a high-level snapshot of your microbiome. It groups the bacteria in your gut into functional categories (what they do) and shows you how your community compares to a reference population.
What You're Looking At
The two donut charts at the top are the heart of this section. "Your Gut" shows the distribution of functional categories in your samples, averaged across the week. "Ideal Gut" shows the same categories based on healthy population averages. Comparing the two tells you where your microbiome looks similar to a well-balanced community and where it diverges.
The goal isn't to match the reference exactly. Healthy microbiomes vary from person to person, and no two guts look identical. Use the comparison to spot broad patterns, not to chase a perfect overlap.
The legend breaks down each category by percentage, giving you a quick read on which groups are well-represented and which may be underrepresented.
The three smaller charts at the bottom show each of your individual samples side by side. Because your microbiome shifts day to day with diet, sleep, and stress, these charts let you see how consistent your gut community was across the collection week. Large differences between samples may indicate your gut is more reactive to daily changes, while similar charts suggest a more stable community.
How to Use This Section
Think of "Your Gut at a Glance" as a map before a deep dive. It orients you to the overall shape of your microbiome and flags which areas are worth closer attention. The next section, Category Breakdown, walks through each functional group in detail, explaining what those bacteria do and what your specific levels mean.
Section 5: Category Breakdown
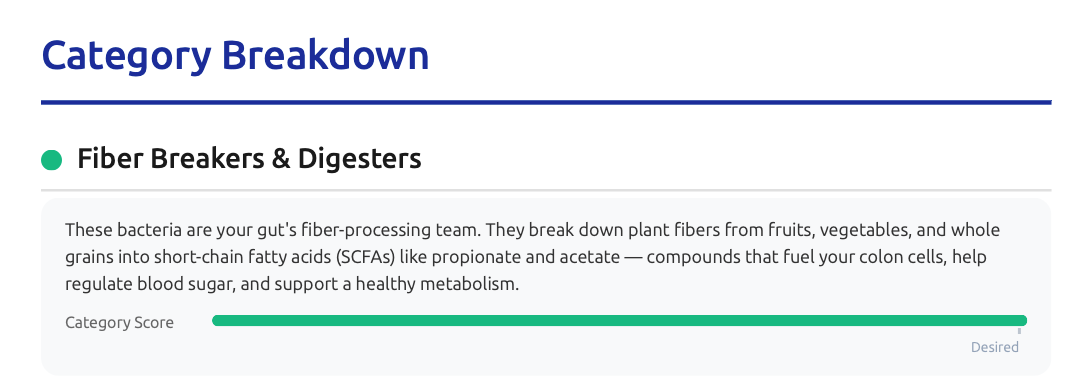
The Category Breakdown is the most detailed view of your microbiome. Each functional category from the previous section gets its own subsection here, with the specific organisms detected in your samples and how they performed across the collection week.
How the Section Is Organized
The breakdown is divided into subsections, one for each functional category — fiber breakers, gut soothers, mucus maintainers, everyday balancers, and so on through bile metabolizers, gut virome, opportunistic bacteria, pathogens, and disease markers. Each subsection follows the same layout, so once you know how to read one, you know how to read them all.
What Each Subsection Contains
The category description at the top explains what this group of bacteria does in your gut and why it matters for your health.
The Category Score is a horizontal bar showing how your overall representation in this category compares to the desired range.
The organism list shows each species detected in this category, ranked by abundance. For every organism, you'll see four pieces of information:
Overall abundance - the average percentage across your three samples, shown on the left.
Sample Trend - a small line graph showing how that organism's levels moved across Sample 1, Sample 2, and Sample 3. A relatively flat line suggests stability; a steep climb or drop suggests your gut responded to something that week (diet, stress, sleep, or illness).
Clinical Indicator - a plain-language summary of what this organism does and why it's relevant.
Learn More - a link to additional detail on the organism, for when you want to go deeper.
A Note on Opportunistic Bacteria
Opportunistic bacteria get their own subsection, and the name can sound alarming, but it shouldn't be. These are organisms that live in virtually every healthy gut at low levels without causing any problems. They become opportunistic only if they overgrow, typically after antibiotic use, illness, or significant disruption to the rest of the microbial community. What matters here is not whether they're present, but whether their levels are elevated and whether they're trending upward across your samples.
Pathogens and Disease Markers - Read These Carefully
The final two subsections, Pathogens and Disease Markers, deserve closer attention than the others. These organisms are either known to cause illness or are associated with specific health conditions. If any appear in your report, we recommend reviewing these subsections with your healthcare provider, especially if you're experiencing symptoms, have recently taken antibiotics, or have a known immune condition.
It's important to keep one distinction in mind: detection is not diagnosis. Many pathogens can be detected at trace levels in healthy people without causing any illness. A small percentage next to a concerning-sounding name does not mean you have an active infection. These subsections are designed to surface information worth discussing, not to deliver a diagnosis on their own.
Section 6: All Taxa Detected
The All Taxa Detected section is a comprehensive inventory of every organism identified in your sample, sorted by abundance. A typical Dayhoff report surfaces 200 or more distinct species across bacteria, archaea, and viruses.
Most users do not need to read this section in detail. It exists for individuals working with a functional medicine specialist or clinical researcher who wants access to the raw taxonomic data. The summary sections above this one are the appropriate starting point for most people.
Section 7: Method Limitations
Dayhoff Health uses shotgun metagenomic sequencing, the most comprehensive method available for gut microbiome analysis. However, it has defined limitations that the report states directly:
- Database coverage is not complete. Species whose genomes are not yet in reference databases will not be identified.
- Viruses, fungi, and parasites detected in your report are identified where database coverage exists, but comprehensive viral or fungal profiling requires dedicated testing.
- This report is for wellness and informational purposes only. It is not a diagnostic tool.
Understanding these limitations helps you interpret your results accurately and set appropriate expectations for what microbiome testing can and cannot tell you.
Frequently Asked Questions
What is shotgun metagenomic sequencing? Shotgun metagenomic sequencing is a method that reads all the genetic material in a sample — not just a single marker gene — allowing identification of bacteria, viruses, fungi, and archaea at the species and strain level.
Why does Dayhoff collect three samples instead of one? The gut microbiome shifts day to day based on diet, sleep, and stress. A single sample captures one moment. Three samples collected over one week establish a true baseline and reduce the impact of daily variation on your results.
What does it mean if a pathogen is detected in my report? Detection at trace levels does not indicate active infection. Many pathogens coexist at low abundance in healthy guts without causing illness. If you are symptomatic, bring the Disease Markers section to your healthcare provider.
What is butyrate, and why does it matter? Butyrate is a short-chain fatty acid produced when gut bacteria ferment dietary fiber. It is the primary energy source for colonocytes — the cells lining your colon — and plays a direct role in reducing intestinal inflammation and maintaining gut barrier integrity.
Can my microbiome report change over time? Yes. The microbiome is dynamic. Antibiotic use, dietary shifts, illness, stress, and sleep changes can all meaningfully alter your microbial composition within days to weeks. Repeat testing is the most reliable way to track whether interventions are working.
Is this report a substitute for medical care? No. The Dayhoff Health Microbiome Report is an informational and wellness tool. Anyone experiencing severe or worsening symptoms — unexplained weight loss, persistent fever, blood in stool — should seek clinical evaluation promptly.
If you have any additional questions or need support, visit support.dayhoffhealth.com.