
Tumor Research Just Got Over 500% Faster

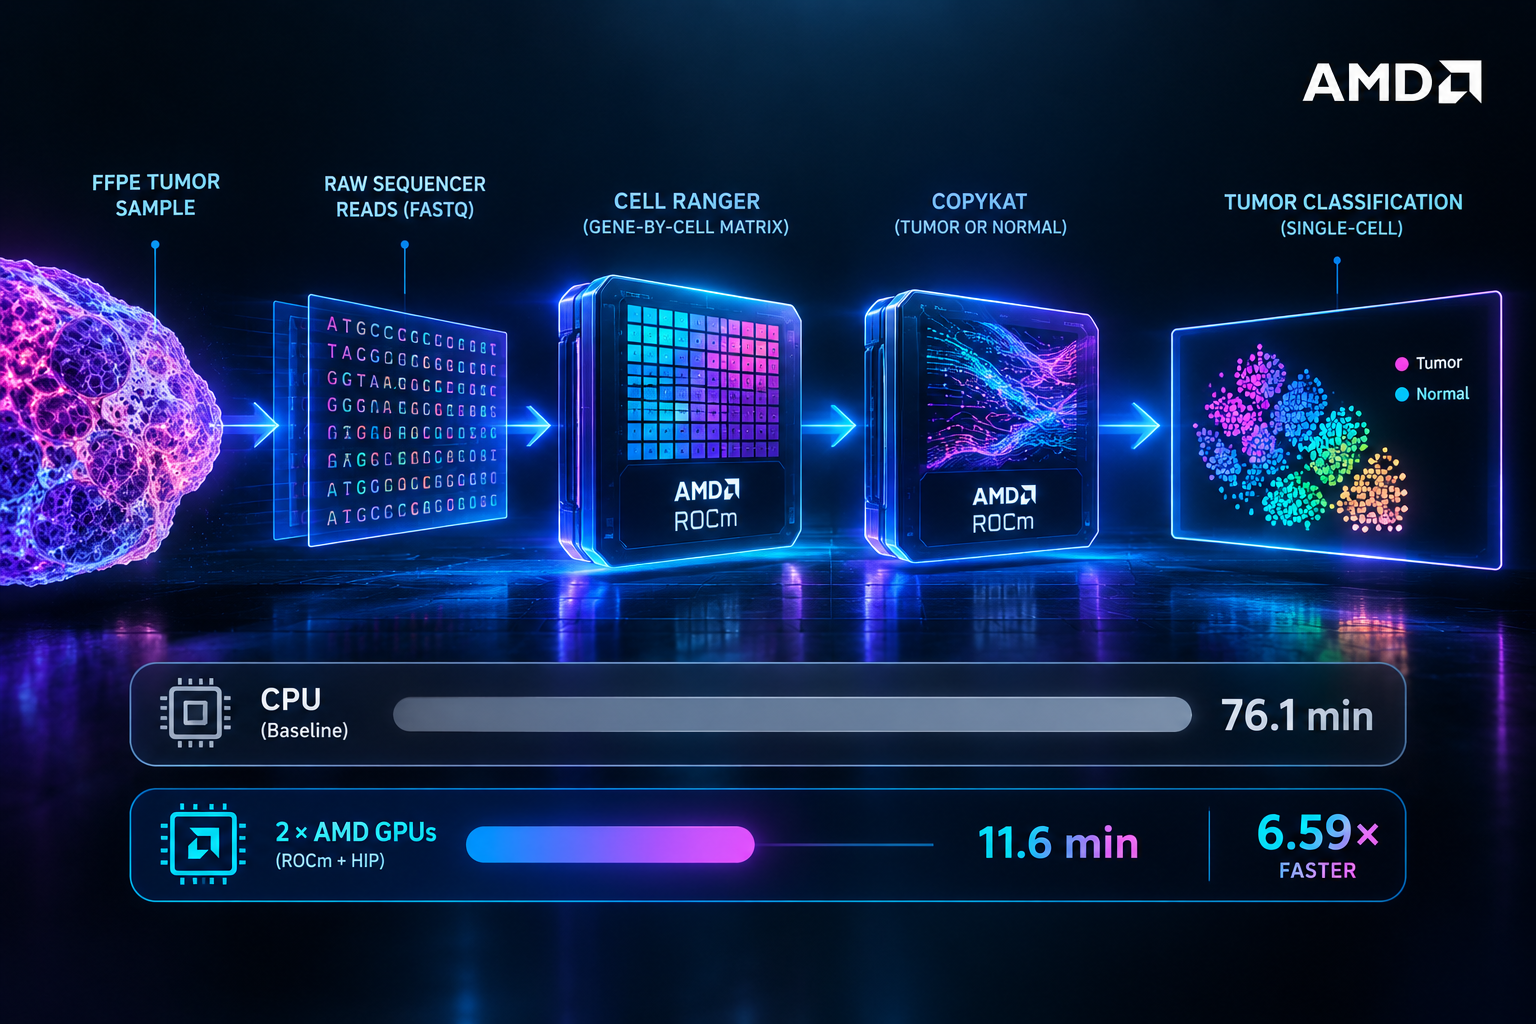
Dayhoff Technologies and AMD moved a complete single-cell tumor-classification workflow onto GPUs, taking a run of 76.1 minutes down to 11.6 minutes, over a 500% end-to-end speedup, with the scientific output preserved. For cancer research, that turns an hour-scale batch job into something a researcher can rerun while they think: parameters, reference versions, and filters become iterable within a single working session, and a fixed compute budget now covers a larger cohort.
It’s worth noting that this is analytical screening of cells within a tumor specimen already obtained. Read the full whitepaper here, authored by Sahib Kamoh and Jacob Shultis on the Dayhoff Technologies team.
Eleven minutes
A single-cell tumor analysis that took our CPU reference 76.1 minutes finished in 11.6 minutes on two AMD Radeon AI PRO R9700S GPUs. That is over a 500 percent end-to-end speedup on a real archival breast tumor: 1.03 billion sequencing reads across four multiplexed FFPE tumor regions, carried from raw sequencer output to a tumor-or-normal call on each of 12,375 nuclei.
Our new whitepaper, documents how we got there using AMD's ROCm platform and the HIP programming model. Below is the plain-language version.
The problem, two heavy steps in a row
If you want to know which cells in a tumor biopsy are malignant, you run two compute-heavy jobs back to back.
Step one turns sequencer output into a spreadsheet. A sequencing machine produces FASTQ files: enormous text files listing hundreds of millions of short DNA fragments. Each fragment carries a molecular barcode identifying which cell it came from. 10x Genomics' Cell Ranger reads every one of those fragments, fixes barcodes that were misread, figures out which gene each fragment belongs to, removes duplicate counts, and builds a gene-by-cell count matrix. Picture a spreadsheet with genes down the side, cells across the top, and a number in every box.
Step two reads the spreadsheet and looks for chromosomal damage. CopyKAT, from the Navin lab, uses a property of cancer biology: tumor cells tend to gain or lose whole chunks of chromosomes, and when a chromosome arm is duplicated, every gene sitting on it gets expressed together as a group. CopyKAT infers each cell's copy-number profile from that pattern and labels the cell aneuploid (abnormal chromosome count, putative tumor) or diploid (normal).
Both tools were built to run on CPUs. Both spend nearly all their time doing the same small piece of arithmetic over and over: once per read, once per cell pair, once per genomic bin. That pattern is what GPUs exist for. A CPU core is a specialist handling one complicated thing quickly. A GPU is thousands of simple workers handling one small thing simultaneously. Millions of identical calculations map onto thousands of GPU threads with almost no wasted effort.
What we changed
We removed the disk round-trip. Stock Cell Ranger writes intermediate read shards out to disk between the sharding, barcode correction, and counting steps, then reads them back. At a billion reads, that write-then-read cycle dominates the clock. We replaced it with a single GPU-resident counter: one HIP program that decompresses FASTQ blocks on the GPU, corrects barcodes on-device, matches reads to the probe panel, and deduplicates straight into the count matrix, never touching disk in between.
We deleted a redundant pass over the data. The legacy read-sharding stage had two jobs: splitting reads into shards, and computing a handful of read-level QC metrics along the way. The resident counter makes the sharding unnecessary, but by default the stage still ran a second full parse of the input just to produce those metrics. We moved that metric computation inside the counter kernel, which was already reading every record once. At small scale the redundancy cost about 4 percent of runtime. At 1.03 billion reads it cost roughly 600 seconds of non-overlapped time sitting directly on the critical path.
We rewrote CopyKAT's two hottest routines as GPU kernels. The pairwise-distance step maps one GPU thread per cell pair, roughly 10 million independent distances. The per-bin median step maps one thread per bin-and-cell combination, using R's exact median rule. Both are swapped in at runtime through R's assignInNamespace, with no edits to the CopyKAT package itself and the originals restored on exit.
What we measured
All timings are wall-clock on a system with two AMD Radeon AI PRO R9700S devices (gfx1201, RDNA4 architecture, 32 GB VRAM each), ROCm 7.x, and local NVMe storage. GPU figures are three-repetition medians. Every run is a complete, fresh pipeline invocation with nothing disabled and nothing resumed.
Cell Ranger, FASTQ to count matrix
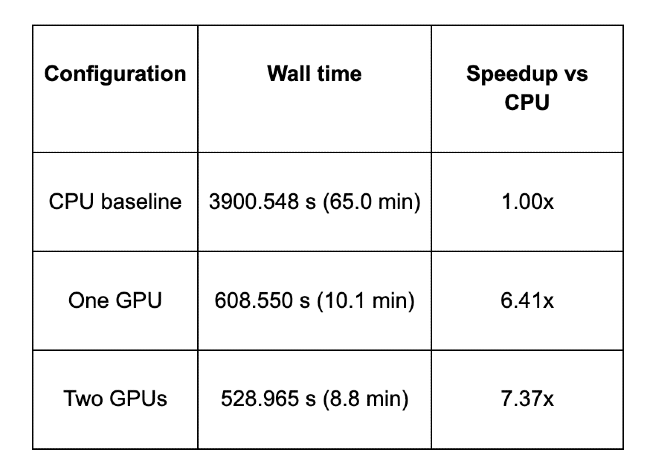
The second device contributes 1.15x on this stage. The resident counter divides complete FASTQ lane pairs across both GPUs through decompression, parsing, probe matching, and lane-local pre-reduction, then merges them before global UMI correction. That preserves the cross-lane molecule accounting while putting two devices on the high-volume front end.
CopyKAT, count matrix to tumor/normal calls
Benchmarked in its realistic standard mode: eight CPU workers, inferred normals, heatmap disabled identically in every arm, all four tumor regions processed.
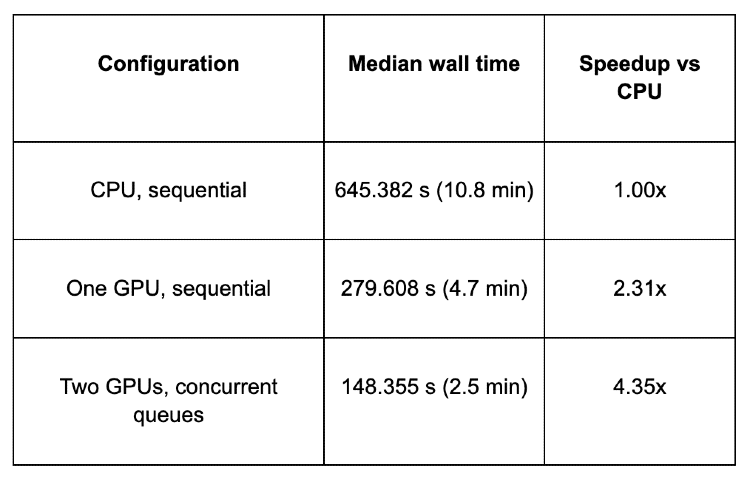
CopyKAT uses one GPU per region and does not split a single region's kernels across devices. The second GPU contributes its 1.88x by running independent tumor regions concurrently through a persistent queue per device. Every GPU shim reported its assigned device and zero GPU-kernel fallbacks.
The complete chain
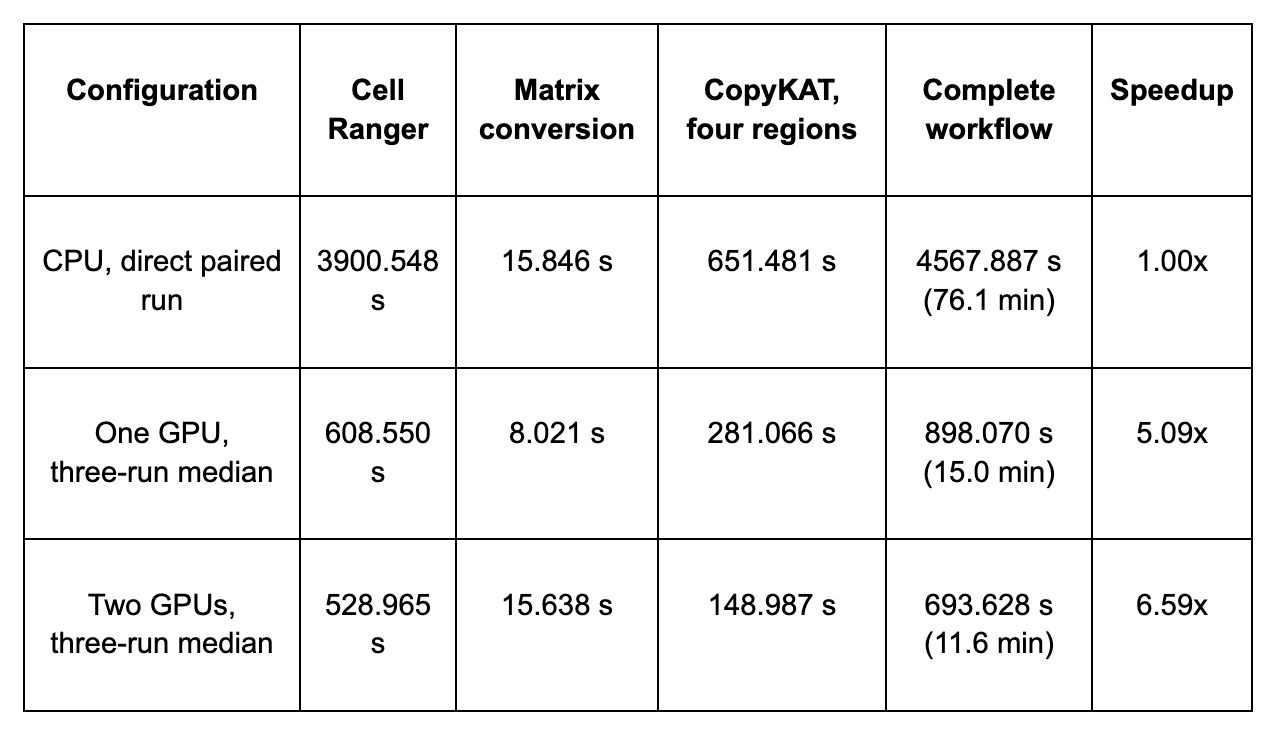
The individual one-GPU repetitions were 902.725, 898.070, and 890.859 seconds. The two-GPU repetitions were 697.085, 693.628, and 685.247 seconds. Run-to-run spread sits under two percent, which matters: these numbers are reproducible, not a lucky pass.
One bookkeeping note carried over from the paper. The phase medians do not sum exactly to the workflow median, because the median for each phase can come from a different repetition. The one-GPU phase columns sum to 897.637 s and the two-GPU columns to 693.590 s, which sit 0.433 s and 0.038 s below their measured median totals.
Where the time actually went
Attributing a speedup to the right cause is the difference between engineering and marketing. These are integrated stage measurements taken from inside real pipeline runs, not isolated kernel benchmarks.
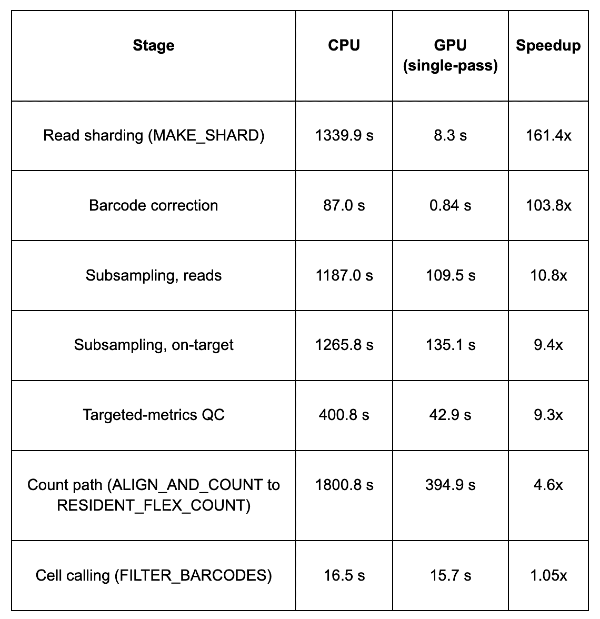
That last row is an interesting one. Cell calling barely moved, and we reported it anyway. Clustering, UMAP, and t-SNE produced no repeatable integrated speedup at this scale. PCA produced a real stage-level gain with equivalent output, but overlapping downstream work absorbed it, so the effect on complete wall time was negligible. Not every stage benefits, and a whitepaper that claims otherwise is not describing a real pipeline.
We also lifted a hard ceiling. Read-chunking, meaning windowed decompression plus barcode-bucketed deduplication, caps peak VRAM regardless of how large the input gets. A 447 million-read sample now runs end to end at 3.6 GB peak VRAM, on a path where an all-at-once approach previously ran out of memory.
Getting the same answer
We held to one rule throughout the project: validate every GPU kernel against the exact CPU or R function it replaces before reporting any speedup. Speed with a different answer is not a result.
Cell Ranger. Per-gene correlation between the GPU matrix and the CPU matrix is 1.00000, with approximately 99 percent element-level parity. The residual differences reflect floating-point ordering and borderline calls. We also anchored against an independent reference: Single Cell Discoveries supplied two small multiplexed datasets (x201 and x202) along with their own official Cell Ranger outputs. Our GPU pipeline reproduced them with per-sample Jaccard of 0.97 to 0.99, identical gene features, zero cross-sample UMI collapse, per-probe correlation of 1.0000, and 47 of 49 standard QC metrics either exact or within 5 percent. The accepted two-GPU output matched the reference across all 20 HDF5 files, 121 CSV files, and 30 compressed-matrix files.
CopyKAT. Standard mode is not bit-reproducible by design, so its correctness is statistical. Across all 9,005 calls in repetition 1, CPU and one GPU agreed on 99.012 percent, CPU and two GPUs on 97.490 percent, and one GPU and two GPUs on 98.190 percent. Across the three continuously timed one-GPU chains, aggregate agreement with the paired CPU predictions ranged from 93.737 percent to 98.512 percent, with the low end driven by region B1_2 while B2, B3, and B4 stayed between 98.6 percent and 100 percent. A separate deterministic run produced byte-identical predictions across CPU, one-GPU, and two-GPU execution. The double-precision distance kernel matches R to approximately 2e-13. Standard mode supplies realistic timing; deterministic mode supplies the strict reproducibility proof.
What the biology says, including the uncomfortable part
Computational equivalence answers whether the GPU reproduces the CPU. It says nothing about whether CopyKAT itself is right. Those are separate claims and we report them separately.
In prior cohorts, the calls line up with published biology: 99.91 percent agreement on TNBC1, and on a matched ccRCC kidney tumor, 95.3 percent aneuploid in the tumor with 99.1 percent diploid in the normal and zero false positives.
On the breast tumor, we checked against the source study's published cell-type annotations, restricted to barcodes present in both the CopyKAT predictions and the published annotations, treating a published malignant label as positive and every other defined cell type as normal. Across nine standard-mode GPU repetitions:
- Aneuploid-call precision was 95.52 to 100 percent in B1_2, 98.99 to 99.83 percent in B3, and 91.92 to 94.44 percent in B4.
- Conditional sensitivity, counting only nuclei that received an aneuploid or diploid call, was 18.3 to 88.3 percent, 97.7 to 99.2 percent, and 99.17 to 100 percent respectively.
- Abstention rates were 45.2 percent, 57.2 percent, and 37.98 percent. Counting those abstentions as misses gives malignant-nucleus sensitivity of 12.6 to 61.0 percent, 64.1 to 65.1 percent, and 72.78 to 73.39 percent.
Region B2 was excluded from the malignant-cell sensitivity analysis because only 50 nuclei overlapped the published annotations, none of them annotated malignant, and 46 received no CopyKAT call at all.
The plain reading: when CopyKAT says a nucleus is aneuploid, it is very likely correct. When it abstains or says diploid, that is not conclusive. The classifier is evidenced as high-precision rather than exhaustive. B1_2 is unstable across both CPU and GPU repetitions, so its swing is a property of the data and the tool rather than of the GPU port. The dataset mixes ductal and lobular carcinoma, and lobular's subtler copy-number changes are a plausible explanation for the miss rate, though this is untested.
One more piece of context. CopyKAT's original validation used conventional whole-cell scRNA-seq. Our tumor input is Flex probe-ligation counts from single nuclei using the snPATHO protocol for FFPE material. Its behavior on that input needed checking rather than assuming, which is why we checked it independently.
What this does not prove
- Results are hardware-specific and dataset-specific, measured on one or two identical R9700S devices, primarily one dataset per workload.
- Two-GPU work is partitioned at natural boundaries. Cell Ranger splits lane-local counter work; CopyKAT runs independent regions concurrently. A single CopyKAT region still uses one GPU.
- Matrix equivalence is high and not exact.
- Quoted speedups are per-stage, not per-kernel. A kernel in isolation can run far ahead of the stage around it.
- Tumor/normal discrimination is validated on one patient tumor.
- A few multiplex metrics are not yet fully faithful. They do not affect the matrix or the timings.
- "Screening" throughout this work means analytical screening of cells within a tumor specimen that has already been obtained. It does not mean population screening, and it is not a diagnosis. Routine clinical use would require separate biological and regulatory validation, outside this project's scope.
Why 11.6 minutes changes the work
Hour-scale runtimes force batch thinking. You queue a job, you go do something else, and if you choose a parameter badly you find out tomorrow. Minute-scale runtimes let you iterate: try a different reference version, adjust a filter, rerun, compare. The same compute budget covers a larger cohort. For labs, the practical consequence is that adding a second GPU raises throughput without standing up a multi-node CPU cluster, and the whole stack runs on open-source ROCm rather than a proprietary dead end.
Technical specifications
Hardware. Two AMD Radeon AI PRO R9700S GPUs (gfx1201, RDNA4, 32 GB VRAM each), dual-socket AMD EPYC Milan CPU (24 cores per socket, 48 vCPUs), 2 TB NVMe storage.
Software. ROCm 7.x. HIP compiled with hipcc --offload-arch=gfx1201. Cell Ranger 10.0.0 (Rust cr_lib, Python, Martian). CopyKAT 1.2.5 in a conda R environment. GPU assignment and architecture settings via HIP_VISIBLE_DEVICES and HSA_OVERRIDE_GFX_VERSION=12.0.1.
Datasets. The x201 and x202 datasets (approximately 5 million reads each) from Single Cell Discoveries, with their authoritative Cell Ranger outputs, served as correctness anchors. The primary benchmark was E-MTAB-14560, a breast-tumor FFPE Flex dataset of 1.03 billion reads from four multiplexed tumor regions with nuclei generated using snPATHO. Published annotations for the same nuclei from CZ CELLxGENE collection bd552f76 provided the external classifier reference. GSE148673, including TNBC1, and the 10x DTC ccRCC dataset provided additional CopyKAT validation.
Frequently asked questions
How much faster is Cell Ranger on a GPU? On a 1.03 billion-read, four-region FFPE Flex dataset, complete Cell Ranger output fell from 3900.548 s on CPU to 608.550 s on one AMD Radeon AI PRO R9700S and 528.965 s on two, giving 6.41x and 7.37x speedups. These are complete cellranger multi runs with no secondary-analysis or reporting stages disabled.
How much faster is CopyKAT? Standard eight-core CopyKAT across all four tumor regions fell from a median 645.382 s on CPU to 279.608 s on one GPU and 148.355 s on two, giving 2.31x and 4.35x speedups.
What is the end-to-end speedup? The complete FASTQ-to-tumor-call workflow fell from 4567.887 s (76.1 minutes) on CPU to three-run medians of 898.070 s (15.0 minutes) on one GPU and 693.628 s (11.6 minutes) on two GPUs, giving 5.09x and 6.59x.
Does the GPU produce the same results as the CPU? Cell Ranger's GPU matrix has per-gene correlation of 1.00000 with the CPU result and approximately 99 percent element-level parity. Deterministic CopyKAT predictions are byte-identical across CPU, one-GPU, and two-GPU execution. Standard-mode CopyKAT, which is not bit-reproducible by design, agreed with CPU on 99.012 percent of the 9,005 calls in repetition 1.
How was correctness validated? Every GPU kernel was checked against the exact CPU or R function it replaces before any speedup was reported. The pipeline was also anchored against Single Cell Discoveries' own official Cell Ranger output on two supplied datasets, reproducing it with per-sample Jaccard of 0.97 to 0.99, per-probe correlation of 1.0000, and 47 of 49 standard QC metrics exact or within 5 percent.
How accurate are the tumor calls themselves? Against published cell-type annotations across nine standard-mode GPU repetitions, aneuploid-call precision was 95.52 to 100 percent in B1_2, 98.99 to 99.83 percent in B3, and 91.92 to 94.44 percent in B4. Conditional sensitivity was 18.3 to 88.3 percent, 97.7 to 99.2 percent, and 99.17 to 100 percent respectively, with abstention rates of 45.2 percent, 57.2 percent, and 37.98 percent. A positive aneuploid call is highly precise; an abstention or a negative call is not conclusive.
Why does the second GPU help CopyKAT more than Cell Ranger? Cell Ranger divides lane-local counter work across two devices, which accelerates the front end while global correction and downstream analysis remain shared, giving 1.15x. CopyKAT assigns whole independent tumor regions to separate devices through a persistent queue each, which parallelizes cleanly and gives 1.88x.
What hardware and software were used? Two AMD Radeon AI PRO R9700S GPUs (gfx1201, RDNA4, 32 GB VRAM each), a dual-socket AMD EPYC Milan CPU with 48 vCPUs, and 2 TB NVMe storage, running ROCm 7.x, HIP compiled with hipcc, Cell Ranger 10.0.0, and CopyKAT 1.2.5.
Did every pipeline stage get faster? No. Cell calling measured 1.05x. Clustering, UMAP, and t-SNE produced no repeatable integrated speedup at this scale. PCA produced a real stage-level gain, but overlapping downstream work made its effect on complete wall time negligible.
Can this be used for clinical diagnosis? No. Screening here means analytical screening of cells within a tumor specimen already obtained. CopyKAT is a classification model rather than a diagnosis, and routine clinical use would require separate biological and regulatory validation beyond this work's scope.
Were changes made to Cell Ranger or CopyKAT themselves? Cell Ranger's count path was replaced with a GPU-resident counter that fuses sharding, barcode correction, and counting. CopyKAT's kernels are swapped in at runtime through R's assignInNamespace, with no edits to the CopyKAT package and the originals restored on exit. Both GPU paths carry a validated CPU fallback.